
Know Exactly What's Working: Advanced Profile Analytics with Custom Date Ranges
Profile views over time, conversion %, and breakdowns by tag, device, country and referrer — with daily/weekly/monthly granularity and any custom range you choose.
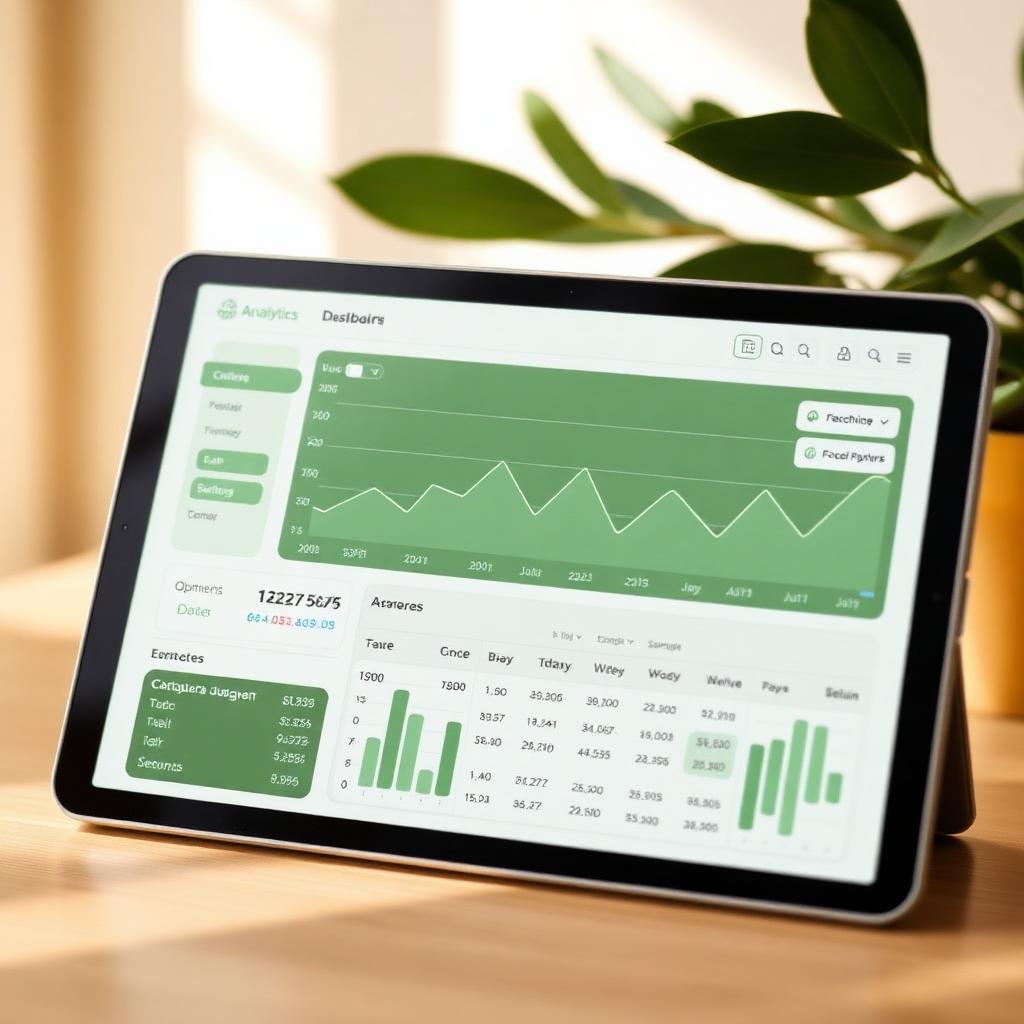
Vanity metrics don't grow businesses. The new Profile Analytics panel on your CigyID dashboard is built around the question that actually matters: ‘What is my tag doing for me this week, and how is that different from last month?’
Date ranges that make sense
- Quick presets — Last 7 days, 30 days, 90 days, 12 months.
- Custom range — pick any start and end date with a single calendar.
- Granularity toggle — view aggregated by day, week or month.
What you actually see
- KPI cards — total views, sharebacks, and conversion percentage.
- Stacked area chart — views vs sharebacks over the selected period.
- Bar chart — views broken down by tag (great for multi-tag accounts).
- Top referrers — which apps and sites are sending you traffic.
- Device split — mobile vs desktop vs tablet visitors.
- Geo breakdown — country-level distribution, no IP storage.
Honest about privacy
Visitor metadata is captured anonymously — we record device class, referrer hostname and a country code derived at request time. We never store the visitor's IP, never link a view to a person, and never sell the data. Aggregations live behind RLS so only the tag owner (or their Org Admin) can see them.
Why it changes how you use your CigyID
When you can finally see that LinkedIn drives 40% of your shareback contacts, that 80% of profile views happen on weekday lunchtimes, or that Hyderabad outperforms Bangalore on conversion — you start optimising the right things. Better posts, better timings, better tags.
One dashboard. The whole story. Free on every plan.